Architecture Overview
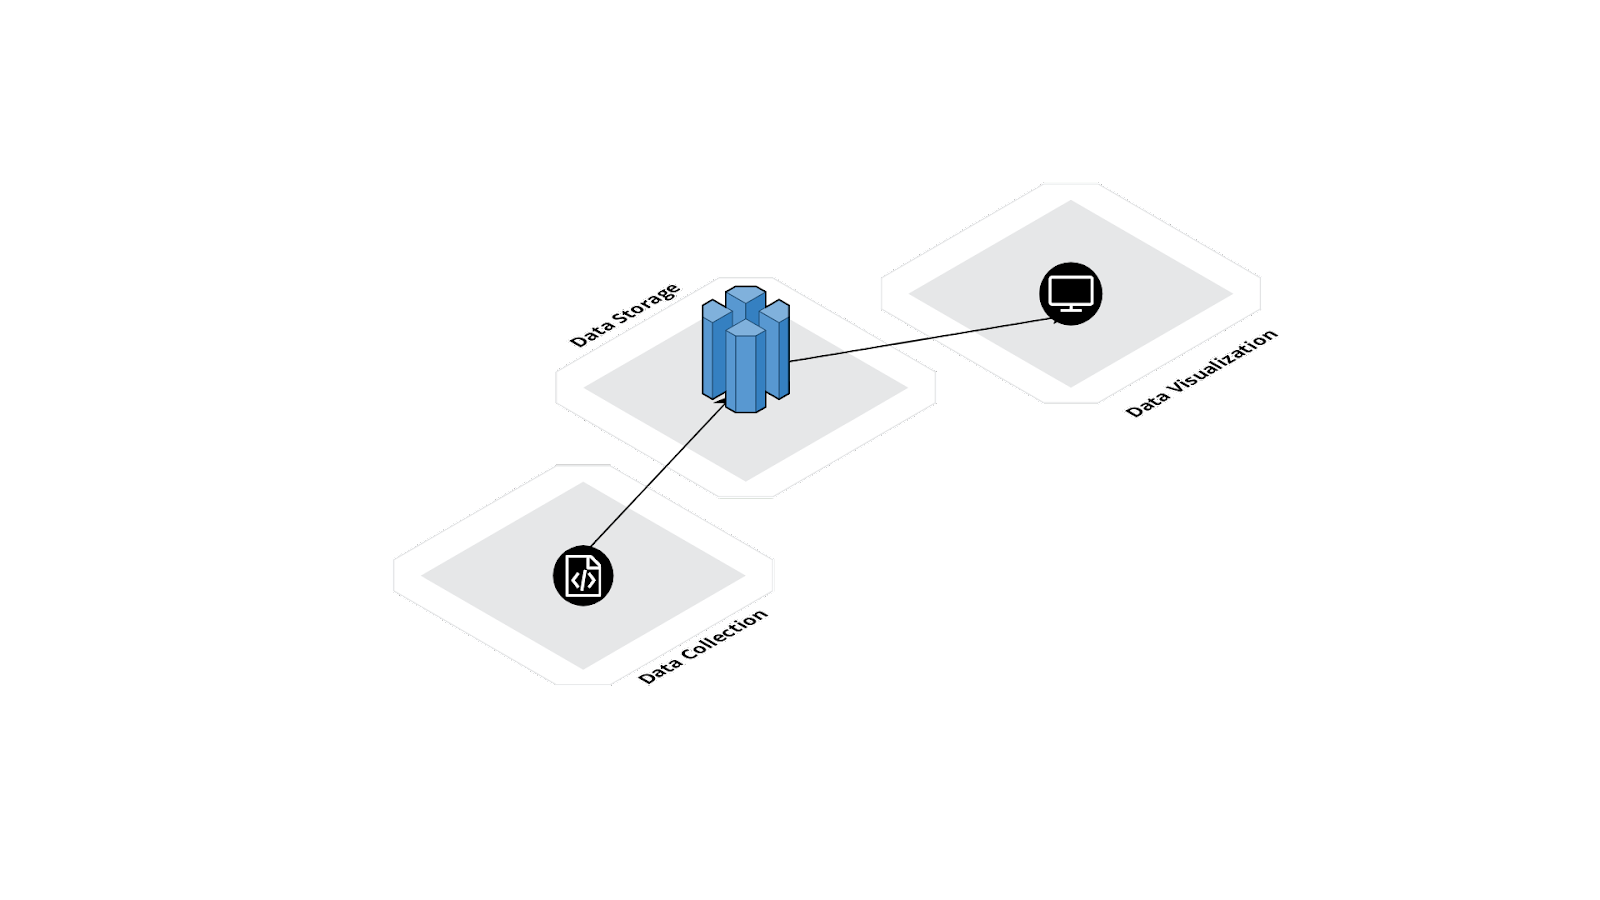
DataLoaf can be mentally divided into three sections, shown in the figure above. They are: data collection, data storage and data visualization.
DataLoaf's infrastructure is deployed to Amazon Web Services (AWS) through the use of a CLI tool. The deployment process is largely automated, and only needs a few pieces of information. The CLI tool makes it easy to provision DataLoaf infrastructure and get started with product analytics. It handles the heavy lifting in deployment and configuration of AWS resources, making self-hosting your product analytics as easy as possible.
Data collection is handled by a combination of the SDK, which captures the data, and the infrastructure that moves that data into the database. The data storage section is the database itself. Data visualization encapsulates the insights application and the infrastructure that hosts it.
The purpose of this section is only to provide a high-level overview of DataLoaf and its design. It's not meant to explain why certain design decisions were made. Decisions and their associated tradeoffs will be explored in the next section.
The SDK and Data Collection Pipeline
The SDK is an npm package for a Node.js-based back-end server application. It has three actions: creating new event data, creating new user data, and updating existing user data. Event data is immutable, so once it's created, it will never be updated. Once the data is sent from the SDK, it needs a way to be transferred to the database.
The figure below shows the infrastructure that represents the data collection pipeline.
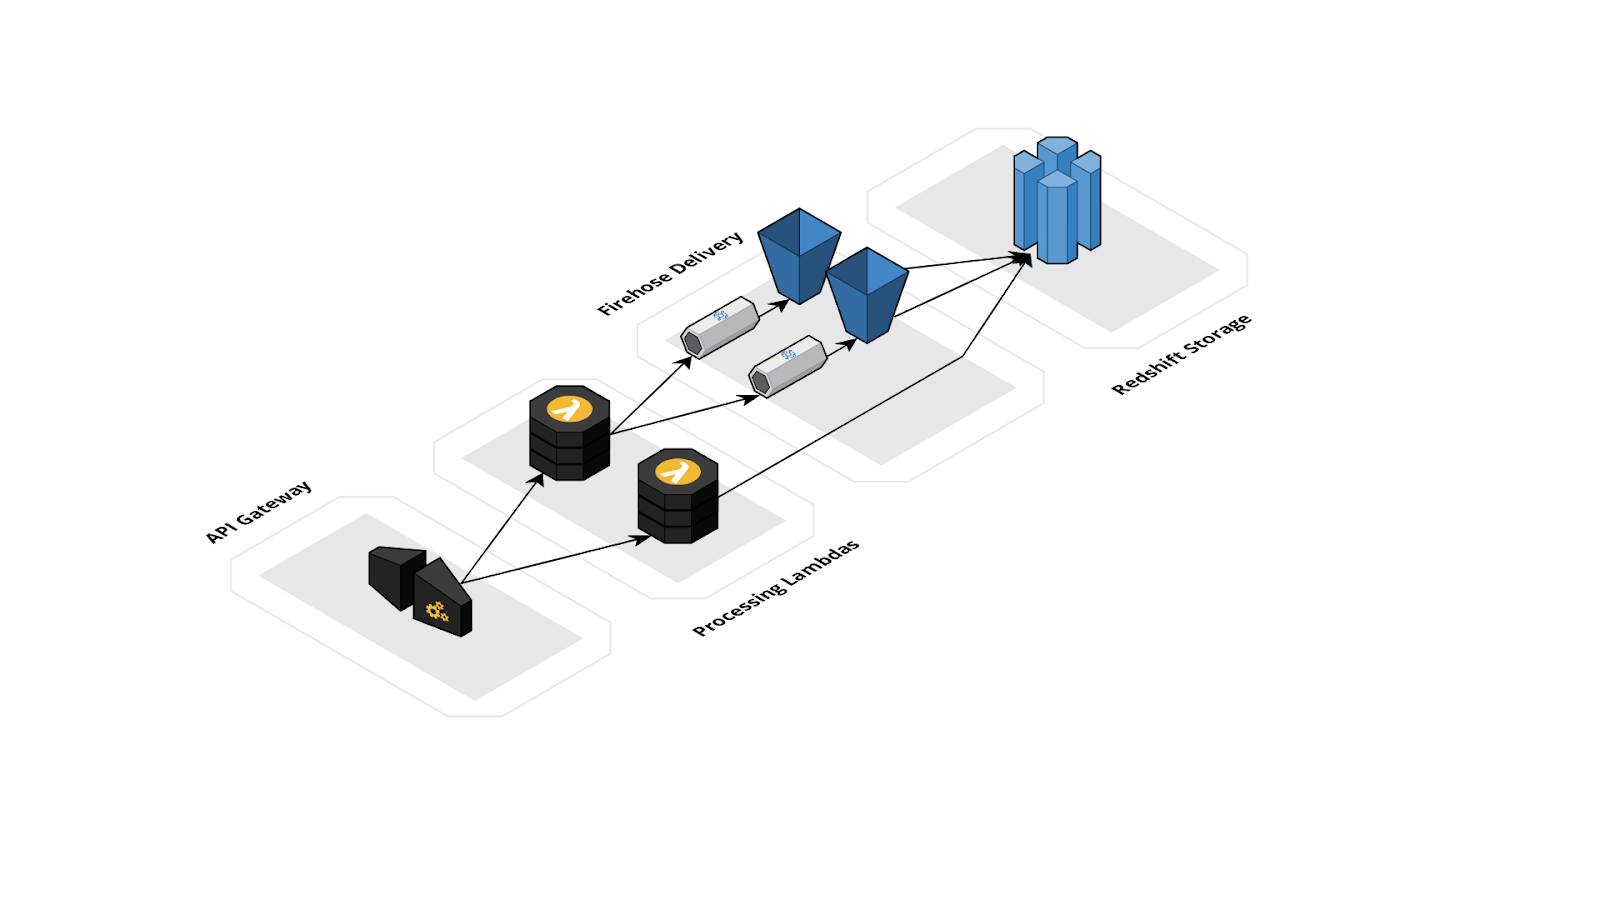
Event and user data are sent from the SDK to an AWS API Gateway. An API Gateway is a fully managed interface that allows AWS infrastructure to field requests from a client application. In the context of DataLoaf, the API Gateway is used to receive data from the SDK and forward it to one of two AWS Lambda Functions. AWS Lambda Functions are functions as a service (FaaS). FaaS are single-purpose functions that are invoked in response to an event, such as a request from an API Gateway. One function is responsible for processing new entries and the other handles user updates.
The AWS Lambda function that processes new data will format and forward the data to one of two Amazon Data Firehose streams. Firehose is a managed service that is designed to receive large amounts of data and ensure its delivery to a specified destination, such as S3, Redshift and others. New events go to one Firehose instance and new users go to the other. Each Firehose stream will send their data to respective Amazon Simple Storage Service (S3) buckets. S3 is a managed file storage system. Event data is collected in one bucket and user data is collected in a second bucket. From there, the data is batch-copied to the primary data store in a single transaction, which happens once every three minutes.
The AWS Lambda function that updates existing user data will interact with the database directly. Using a Lambda function allows for partial updates, which is very important. Because existing attributes might not be part of the update data, the operation needs to be able to retain existing data instead of just overwriting it completely with the new information. This function will pull the existing user information from the database, merge the data together and then write the updated data back to the user's entry.
Data Storage in Amazon Redshift
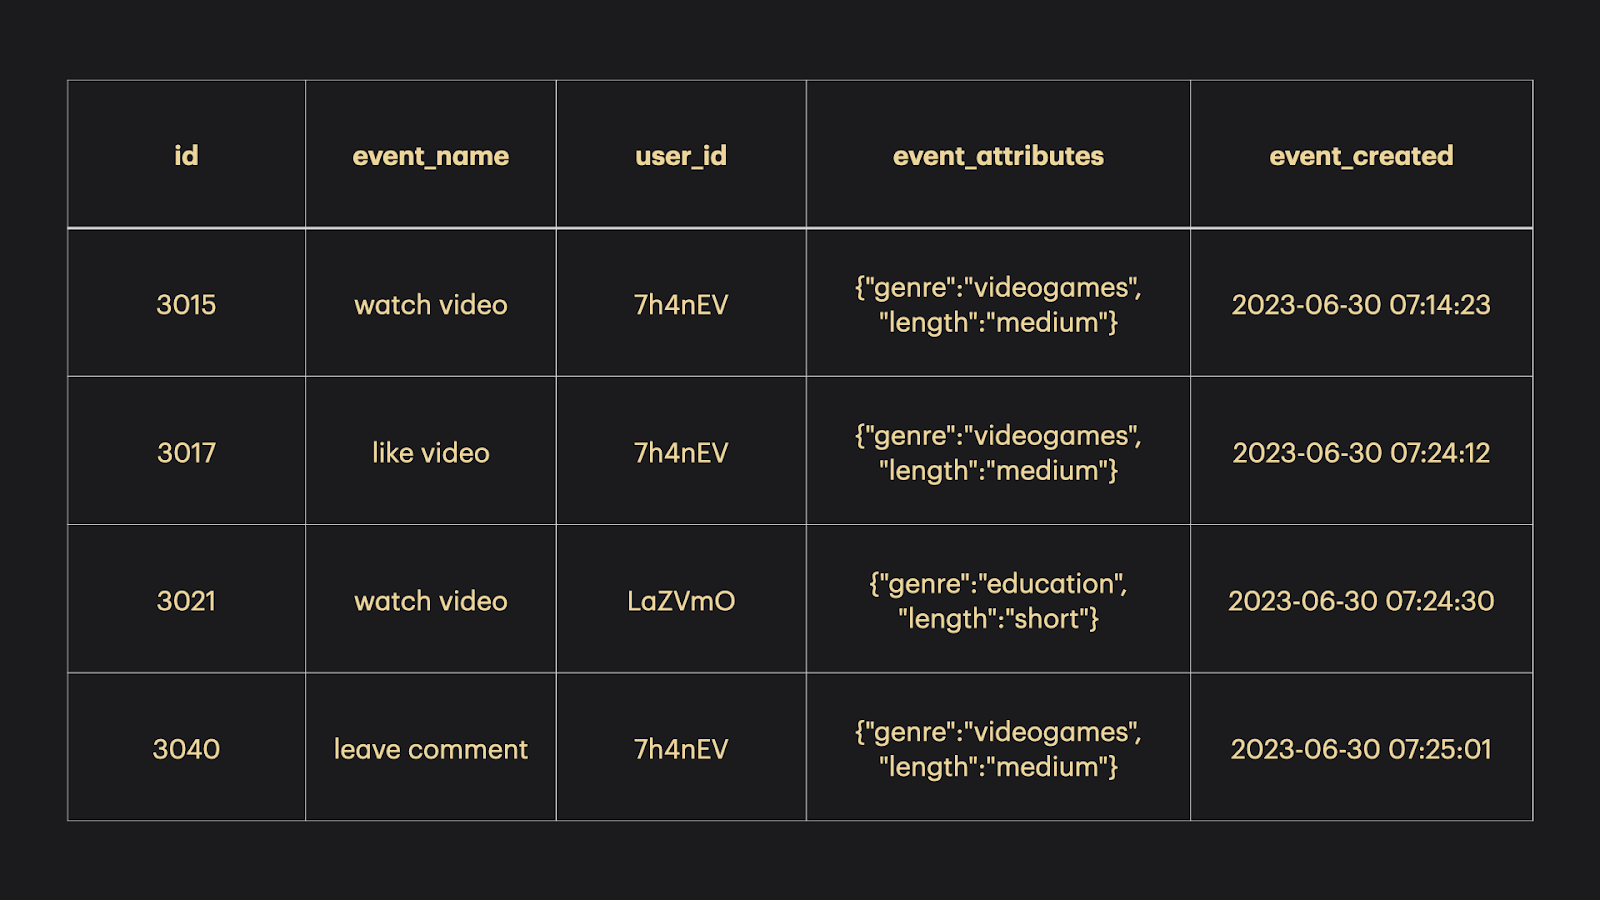
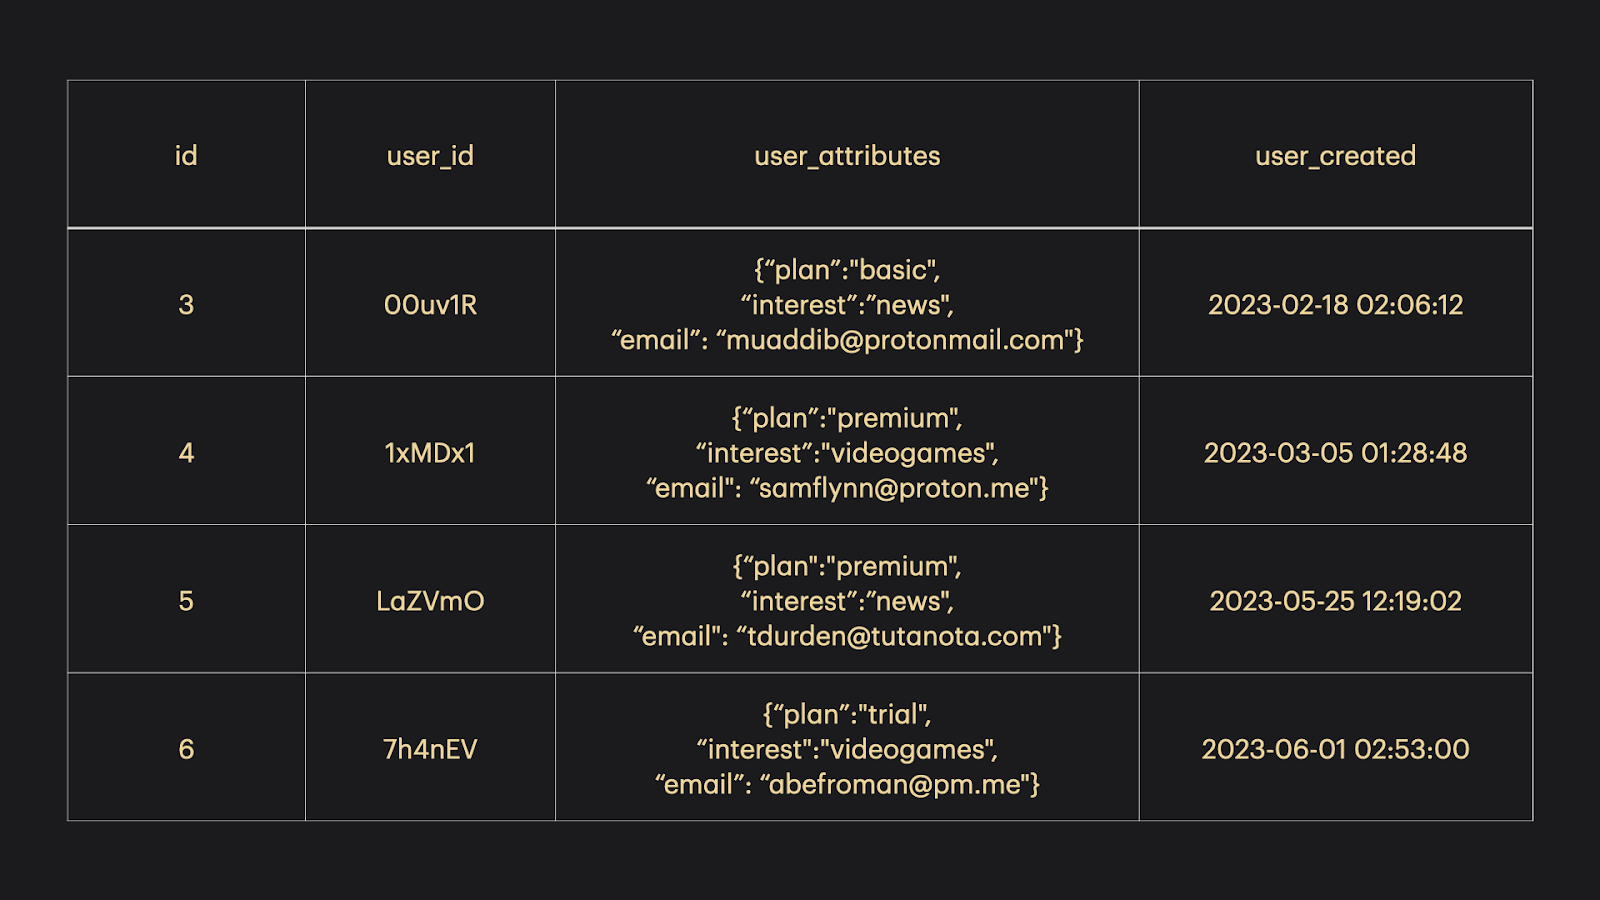
Amazon Redshift is the primary data store for DataLoaf. It contains two tables that are created when the infrastructure is provisioned with the CLI tool. One events table and one users table. The following figure shows example entries from both tables.
Redshift is a columnar database built on top of PostgreSQL. columnar databases are ideal for performing analytics workloads due to a number of optimizations that will be covered in a later section. In short, the data storage patterns of columnar databases allow for improved query speeds when doing the aggregations commonly found in analytics (counts, averages, medians, etc.).
It also integrates with a number of other AWS services, such as Amazon Data Firehose, S3, AWS Glue, Amazon EMR and more. This gave us several options when choosing the necessary components of our data pipeline.
Redshift is also fully managed. It provides many features out of the box that traditionally require large engineering efforts to roll out. For one, it is sharded, which allows it to scale across additional nodes as overall storage capacity needs increase. It also provides query caching, meaning that repeated queries on unchanged data return responses almost immediately, increasing the responsiveness of the UI for DataLoaf.
Data Visualization with the Insights Application
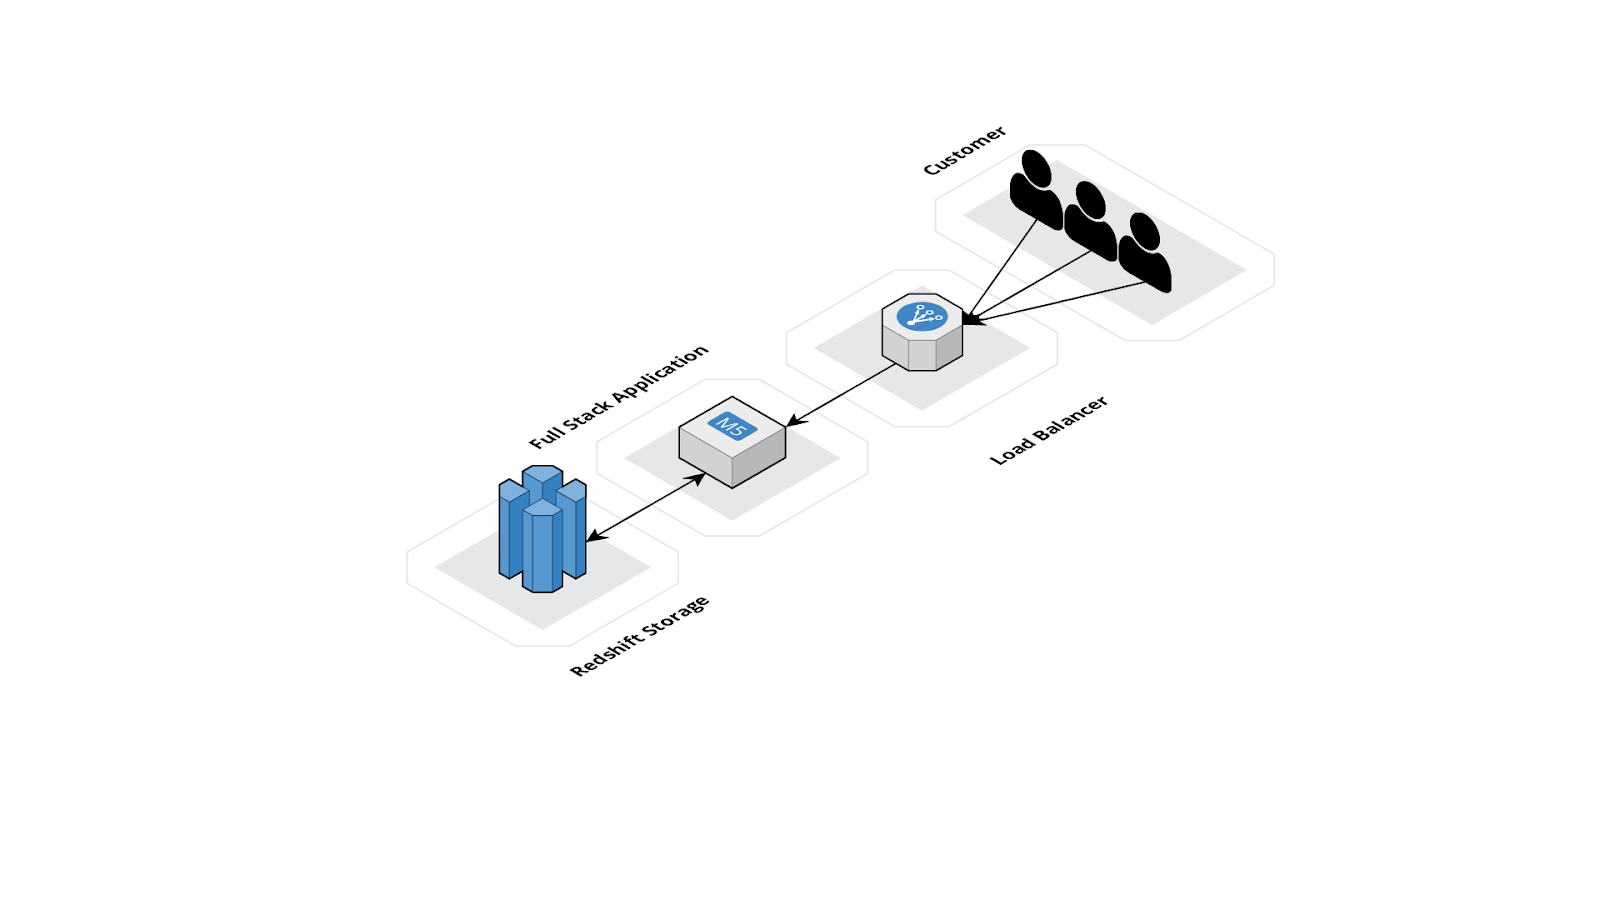
The figure above shows the infrastructure of the data visualization section.
During the provisioning process, an Amazon Elastic Compute Cloud (EC2) instance is deployed. The EC2 instance hosts the back-end and front-end of the insights application. Nginx is used as a web server, and it serves the front-end application. It also forwards requests to the Express back-end. When a new selection is made in the insights application for a new data visualization, a request containing the selections are sent to the back-end.
There is an option to add an Amazon Elastic Load Balancer (ELB) to the infrastructure if a valid domain is provided to the CLI. If provided, the CLI will automate the SSL/TLS certificate process to allow for HTTPS requests to hit the Insights application.
Both our back-end application and Nginx server are deployed via Docker. The use of Docker enabled a simpler deployment process due to the integration of configuration files within our back-end and Nginx containers. This standardization and easy integration allowed for a simpler deployment process within the EC2 instance.
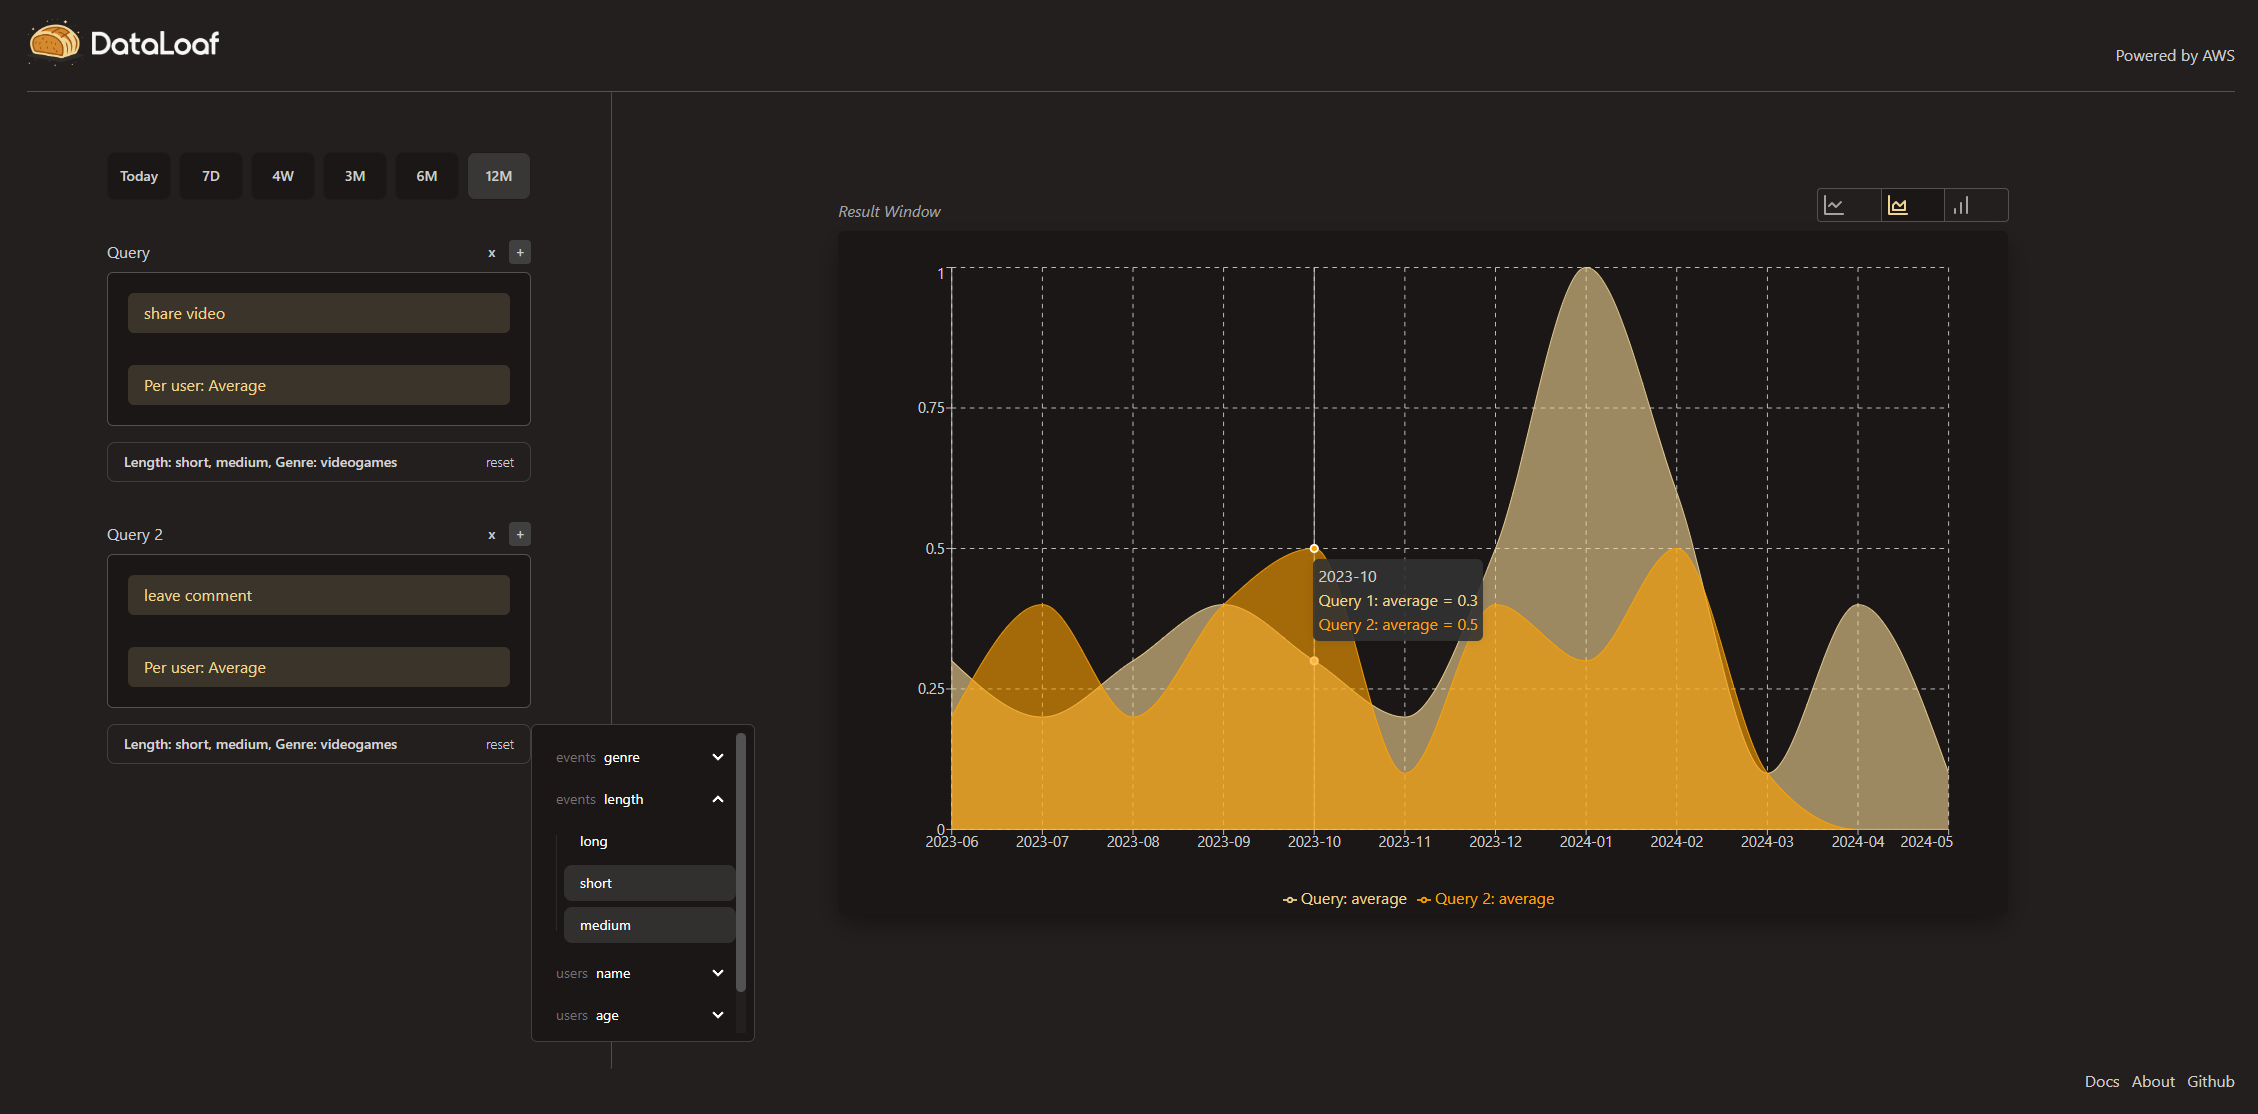
The figure above showcases how DataLoaf’s insights application can be used to obtain event and user data. The query builder on the left of the interface allows for questions to be constructed. The result is visualized in the “Result Window” on the right side of the interface. A query can be built using up to four components: the event of interest, the aggregation type, the aggregation period and, optionally, any additional filters.