Product Analytics
Product analytics is a branch of data analytics that focuses on gathering information about how users engage with a product. Companies can use that information to make data-informed decisions about how a product should evolve.
Analytics data is captured and referenced with the help of a product analytics platform. Several platforms exist, including Mixpanel, PostHog and Amplitude. Each of these platforms can be used to collect and visualize insights into how an application is being used. These platforms are managed. This means that the company that supports the platform is responsible for storing and providing a way to view your application's data. Managed platforms come with some advantages, but have several drawbacks.
This section will introduce the field of product analytics and explore the tradeoffs of using a managed solution. It will also explain how a self-hosted platform might be more desirable, and discuss how DataLoaf can fill this role. Once product analytics is understood more deeply, discussions about the challenges of implementing such a platform can make more sense.
Product Analytics Help Drive Business Decisions
When companies don't understand how their users are engaging with an application, it can be difficult to know if they're making effective decisions about the future of their product. For example, without a tool like product analytics it could be difficult to know whether or not users have noticed the launch of a new feature. Worse, maybe users are having a comparatively negative experience and stop using the application in frustration.
Feedback about a new feature is only one way in which product analytics can impact a company.
Take Twitch for example, a popular live streaming platform for video games. It started in 2007 under the name of Justin.tv as a way for anyone to livestream their daily life. Within a couple of years, once different categories had been added, the viewership for streaming video games far outstripped lifestyle content. Following this, the owners decided to create a spinoff site called Twitch that would focus exclusively on video game streaming[1]. A product analytics platform would have been the perfect tool to confirm this trend.
But what about more subtle trends? Another potential use for a product analytics platform would be to get the information necessary to decide where to allocate the budget for marketing. Say the company is a video streaming service that's trying to compete with YouTube. They can use a combination of regional data and "video played" event data to generate insights that will clearly display where users in one region are lower than another region. This information can be used to allocate a higher marketing budget for the region with less viewing frequency.
How Existing Product Analytics Platforms Work
The implementation details of each product analytics platform are different, but all of them have a consistent need for the collection, storage and visualization of user engagement data.
The collection of data is usually handled by a server-side or client-side SDK that is imported into a company's application. When a user triggers an event in the application, the SDK sends that data to the product analytics platform to be stored in some sort of database. From there, the company can use the platform's insights application, which is the graphical interface that’s used to visualize the data. These graphs are used to draw conclusions about user engagement.
The most important thing about a product analytics platform is that it's there to answer questions. A video streaming company might ask: "How many videos were watched each day in the last week?"
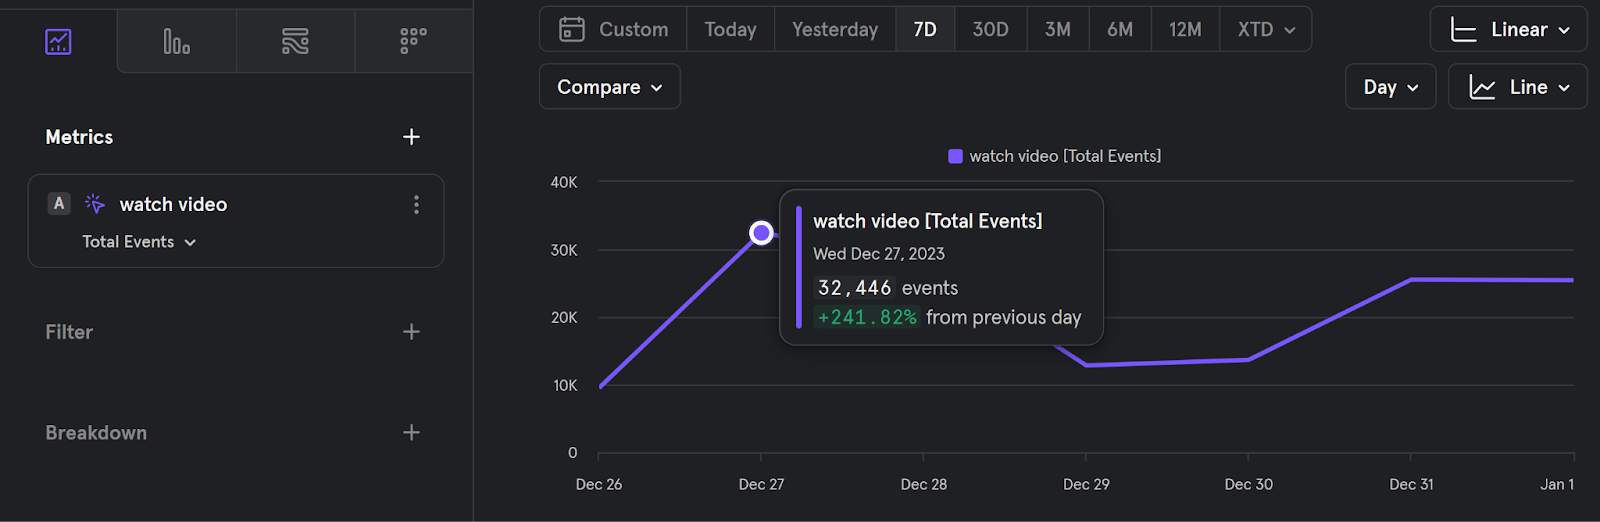
The above figure is a screenshot of Mixpanel's data visualization interface with some sample data that can answer this question. Two pieces of information have been selected from the dropdowns on the left of the screen (under "Metrics"): "watch video" and "Total Events."
"watch video" is an example of an event, which is a category of data that can be tracked through the platform's SDK. An event represents an action that a user can take when interacting with the company's application. An 'action' can be anything, from common tasks like signing in to an account to more specialized tasks like playing a video or adding an item to a cart. Events are defined by a custom and unique title through the SDK. These custom events (like “watch video”) can then be selected from the dropdown in the interface. This covers the "videos were watched" part of the question.
"Total Events" is an aggregation type. Aggregation types are used to take a collection of values and reduce it down to a single point. Some examples are "sum" or "average." The aggregation type determines which equation is used to arrive at this reduced number. In this case, "Total Events" will sum up the total number of the selected custom event. This covers the "How many total..." part of the question.
There's a list of buttons above the graph that represent the aggregation period. This screenshot has "7D" selected, which means "seven days." This part of the selection covers the "over the last week" part of the question. This selection will break the collection of values into groups that the aggregation type will use as input for its calculations. For example, since the last seven days have been selected, the data will be divided up into groups based on each day and then reduced. If "today" had been selected instead, the values would be divided along a per-hour basis instead of a per-day basis before being summed together.
The insight, a line graph, is generated as a result of these selections ("watch video" for the event type, "total events" for the aggregation type and "seven days" for the aggregation period). These selections are put together to answer the question: "How many total videos were watched each day in the last week?" The company can clearly see that over 30,000 videos were watched on December 27th. Likewise, they can see that there were significantly fewer watched videos on December 30th (around 13,000).
To show an example of how another aggregation type works, here's a different question: "How many unique users watched videos each day in the last week?"
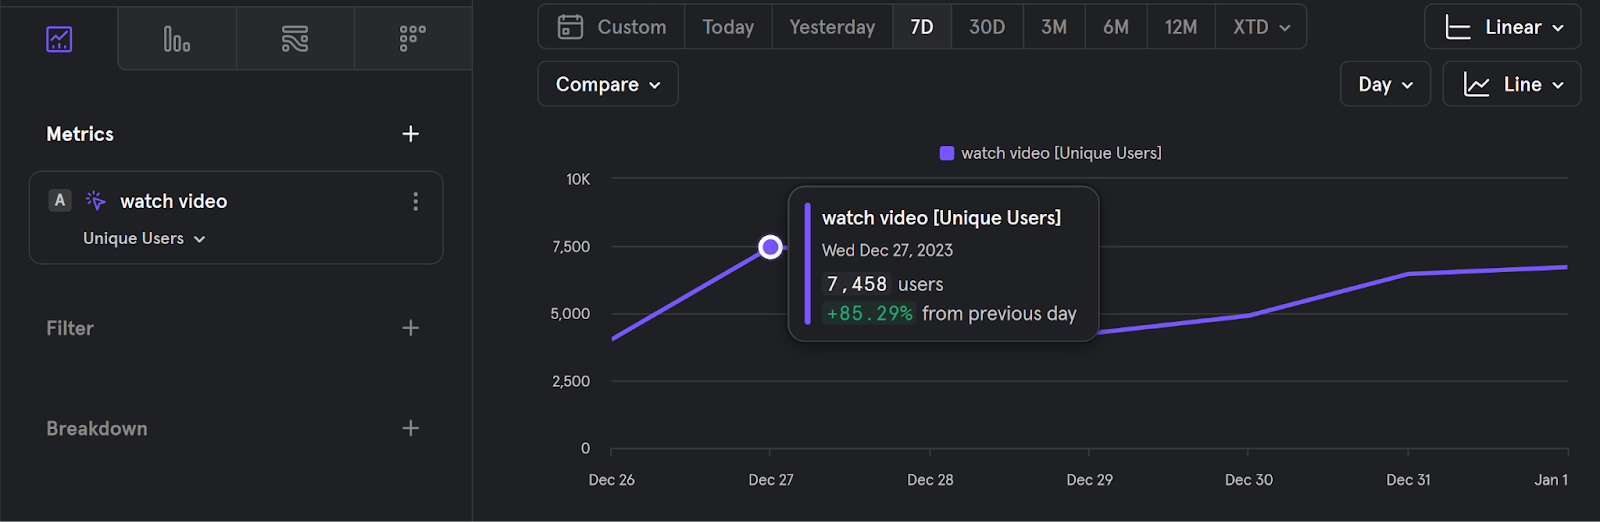
The aggregation type has been changed to "Unique Users." A completely different set of data is generated and displayed by the line graph. It can be seen that there were nearly 8,000 unique users that watched videos on December 27th.
Users are another category of data that’s collected by the SDK. They represent an individual that is interacting with a company’s application. Whenever a platform records an event, the user that took the action is associated with that event. This allows for questions to be asked based on individual users.
What about more complicated questions like: "How should we distribute the marketing budget based on regions that get less views?" This is where attributes come in. Attributes are a third category of data. They’re values that are associated with an event or user when the event or user is registered with the SDK. The company can add as many attributes as they want.
A question that can be asked using attributes is: "How many videos were watched last week in Alaska?" The scope of the question is being narrowed from total videos watched to only the videos that were watched in a specific region.
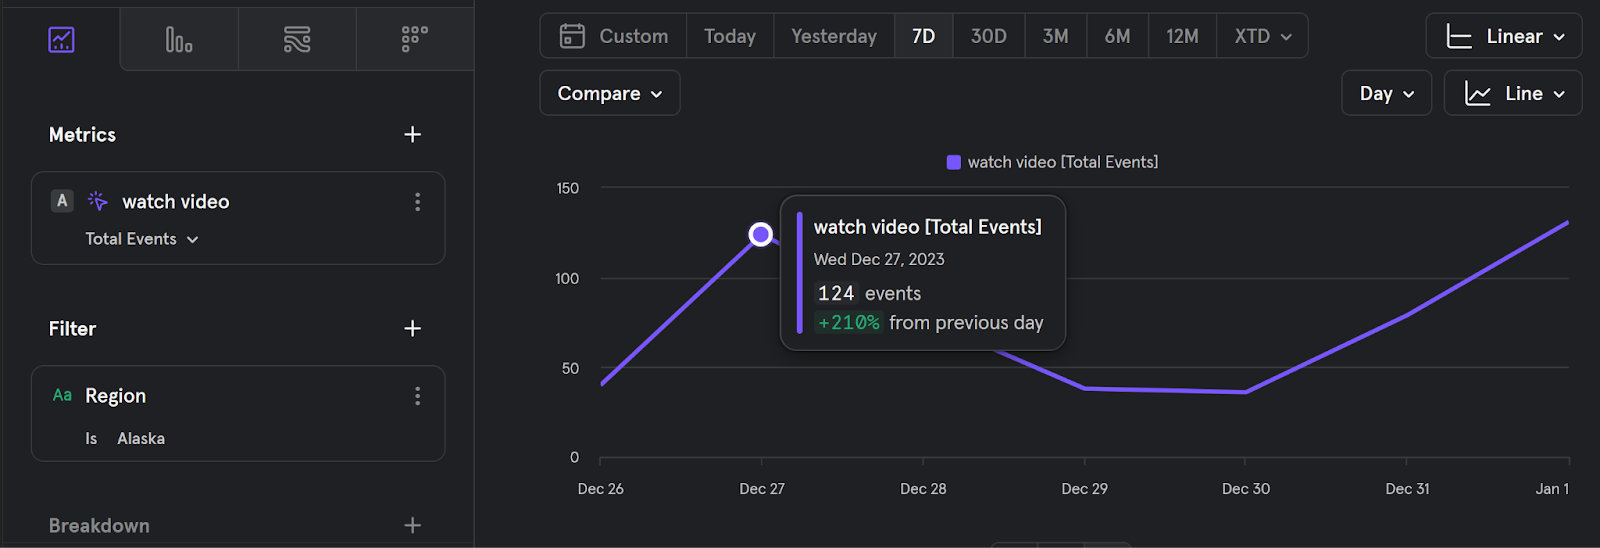
The aggregation type on the left side of the screenshot has been changed back to "Total Events" to line up with the question that's being asked. Also note that a Filter has been added. Filters are the real power of product analytics platforms - they filter aggregation calculations based on the attributes that are associated with an event or user, and they can be anything that the company needs them to be. In this case, the company is able to look at the total number of videos that were watched in the region of Alaska over the last seven days. On December 27th, 124 of the 30,000 globally watched videos were viewed in Alaska.
A little more information needs to be gathered to be sure that the percentage of videos that are being watched in Alaska is small enough to warrant a higher marketing budget for that region. Fortunately, product analytics platforms make it easy to get that information. Companies have complete control over the types of events and their associated attributes. What kinds of events and attributes a company is interested in depends on the questions that they want to answer.
The Tradeoffs of Managed Product Analytics Platforms
Platforms like Mixpanel and PostHog are called managed. This means that when data is sent from a company's application, it gets stored in a database that's hosted and maintained by the platform provider. Likewise, the insights application that was shown in the last section is accessed through an account on the platform's website.
There are positives when choosing to use a managed platform, which mostly come in the form of convenience. Companies won't have to provision and manage any of the infrastructure that's used to collect and store application data. Nor will they have to create and manage the code that's associated with an SDK and the insights application. Paid tier options also come with compliance guarantees to industry and privacy laws, such as General Data Protection Regulation (GDPR) and Health Insurance Portability and Accountability Act (HIPAA).[2]-[3]
Managed platforms usually allow a number of events per month for free. For example, Mixpanel allows for 20 million events per month on all tiers[2], and PostHog allows 1 million events per month for free, before charging you on a per-event basis. On PostHog, 20 million events per month will cost close to 2,000 dollars per month[3].
This convenience comes with some sacrifices.
Because the pricing of managed applications is typically based on the number of events ingested per month after the free event limit has been reached, cost can quickly become a problem. A single user can generate tens to hundreds of events in a single session, depending on how the company has decided to track information. This also limits how much data a company can store per month.
In addition to cost, there's another significant drawback: less control over the data. Companies that use a managed platform have no control nor ownership over the data that their application generates. They depend on the platform to store that data safely and keep it available at all times. There is no guarantee of recourse if something goes wrong.
The Role of DataLoaf as a Product Analytics Platform
In contrast to 'managed' platforms, there are 'self-hosted' platforms. There are two things that 'self-hosted' could mean in the context of product analytics.
One of them is a platform that is completely self-hosted. This usually takes the form of a package of files that can be deployed to an infrastructure and web domain of the company's choice. This path can take a lot of work and technical knowledge to set up properly, because the company needs to understand the pieces of their desired infrastructure and know how they fit together. They'll also need to know how to host the insights application. PostHog offers something like this in the form of a set of Docker images.
The other kind of platform is one that is self-hosted in the sense that it's a 'seed' that gives the company a starting point. Its infrastructure is provisioned with a cloud provider like Amazon Web Services (AWS). They still have access and control over the infrastructure, and can even go in and make any changes that they may want through the account's console interface. It's also possible to host the insights application automatically. DataLoaf's role is to be this second kind of self-hosted.
Being a self-hosted product analytics platform, DataLoaf offers robust analytics functionality out of the box while still providing full control over your data, infrastructure and feature set. Since the code is completely open-source, it can be expanded and customized to fit individual needs.h a description of some additional work that could improve the project moving forward and a conclusion.